Erik Svensen – Blog about Power BI, Power Apps, Power Query
I have for a long time had the wish to use the power of R to create some fancy visuals in PowerBI, but I simply haven’t had the time to read the manual 🙂
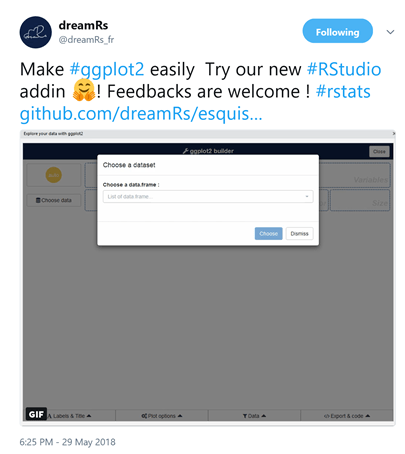
Then today I saw a retweet about how to make ggplot2 easily –

And thought that might be able to help me get started – AND IT SURE DID
The tools are still under development so expect a few bumps
First – RStudio
You need to install RStudio on your computer to support the Addin. So if you haven’t done so already – go to https://www.rstudio.com/
To install the addin you can follow the instructions on the github site for the addin – https://github.com/dreamRs/esquisse
Simply insert this in code window and run it
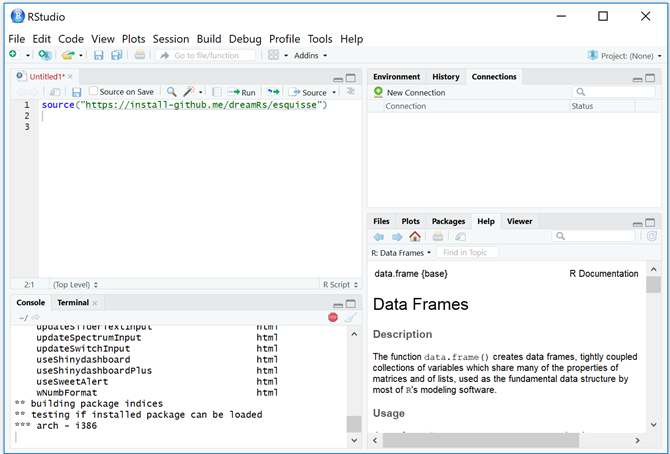
R-Studio will then install the addin and all its help files etc.
Now we can run the addin by running this line
esquisse
Ursprünglichen Post anzeigen 401 weitere Wörter

Hinterlasse einen Kommentar